
Apache Spark has become the go-to framework for big data processing, and for good reason: it's fast, versatile, and (once you get the hang of it) surprisingly elegant. But mastering it? That's a whole other story. Spark is packed with features and an architecture that feels simple on the surface but quickly grows in complexity. If you've ever struggled with long shuffles, weird partitioning issues, or mysterious memory errors, you know exactly what I mean.
This article is the fifth in a series on Apache Spark — created to help you get past the basics and into the real nuts and bolts of how it works, and how to make it work for you.
Apache Spark is a distributed computing engine. Its main feature is the ability to perform computations in memory.
That's what the brochure says.
And while that's technically true — Spark can crunch terabytes in-memory across a cluster of machines — what that brochure is not saying is that the exact same job that ran fine yesterday can blow up with an OutOfMemoryError today, and you won't even know what changed.
Welcome to the wild west of memory management in Spark!
The concept of memory management is quite complex. Python has its arenas and pools, C has malloc/free hell, and Java has garbage collectors and metaphysical tuning flags. Spark adds another abstraction layer on top of all that, and most engineers — myself included (back when I was young and hopeful) — treat it like magic and hope for the best.
For better use of Spark and to achieve high performance with it, however, a deep understanding of its memory management model is important.
Hell yeah, we're diving into Apache Spark memory management!
High-level Overview
The memory management system in Spark is built on layers of abstraction stacked on top of each other like a bad lasagna.

Here's the rough breakdown of Spark's memory management layers that you should keep in the back of your head:
- OS level — your Linux kernel doesn't care about Spark. It just sees processes with memory requests.
- JVM level — Java heap, off-heap, metaspace, GC overhead… the classics.
- Cluster manager level — YARN, Kubernetes, or Mesos enforces resource limits.
- Spark application level — where things get weird.
We're not going to deep dive into all of them, but you need to know that these layers exist because Spark memory errors often come from the boundaries between them, not just from the application layer
Let's rewind for a second. What actually happens when you launch a Spark app?
When you submit a Spark job, the cluster spins up two kinds of processes — Drivers and Executors:
The Driver is the control tower. It creates the SparkContext, parses your code, splits it into stages, schedules tasks, tracks metrics, fails things, retries things … you get the idea. The Driver is just a regular JVM process (usually with way too little memory), and its memory model isn't special — so we'll mostly ignore it here.
Executors are the actual workers. They run your tasks, spill your data, and eat your memory. Each executor runs as a JVM inside a container (YARN, Kubernetes, etc), and this JVM is where Spark does both storage and compute — shuffles, caches, broadcasts, UDFs, Arrow memory, native code, GC, off-heap buffers… all fighting for the same scraps of RAM.

Spark tries to manage all of it with some hardcoded fractions and a few memory pools. It's amazing that everything works at all despite that. Let's go deeper into the Executor memory.
Executor Container
When you submit a Spark job in a cluster — whether it's YARN, Kubernetes, or something weird and/or custom — Spark spins up Executor containers on worker nodes. These are the JVMs that will actually do the work: running your tasks, spilling data, caching results, and shuffling data back and forth across the network.
Now, let's talk memory. Who's in charge of giving it out?
Well, that depends on the cluster manager.
YARN
YARN has two components that control resource allocation:
ResourceManager — the cluster-level boss, it decides how much memory you're allowed to ask for based on yarn.scheduler.maximum-allocation-mb. If you ask for more than that, you get nothing or worse, a silent cap and unexpected crashes.
On a single node, it is done by NodeManager. It manages memory allocation on each individual node, based on yarn.nodemanager.resource.memory-mb, which sets the upper physical memory per node.
Kubernetes
On Kubernetes, Spark uses the pod model:
- Each executor is a pod.
- Pod memory is controlled via resource requests/limits, which map to container-level cgroups.
- If your process (heap + off-heap + Python + native) exceeds the pod limit, Kubernetes won't hesitate —
OOMKilled.
So, when Spark talks about an Executor, it's really talking about:
A single JVM process running inside a container (YARN or Kubernetes pod), allocated a fixed amount of memory.
That container is carved up into three main memory areas:
- Heap memory — the JVM heap, controlled via
--executor-memory. - Off-heap memory — for native buffers like Arrow or Tungsten, outside the JVM.
- Memory overhead — for JVM internals, Python workers, and native memory.

We'll walk through each of these in the following sections.
Dive Into The Heap
This is the big one — the memory most people think of. This is the memory size specified by --executor-memory during submission of the Spark application or by setting spark.executor.memory.
Internally, this becomes your JVM heap size (-Xmx). Spark uses this memory to hold most of your cached data, shuffle buffers, task results, UDF outputs, etc and yes, it's subject to garbage collector (GC), which means you'll spend a lot of time debugging mysterious GC pauses if you're not careful.
Spoiler: it's not all available for your code. Spark slices and dices it further.
To understand this madness, we'll need to look into Spark's MemoryManager (source: org/apache/spark/memory). That's the interface Spark uses to track and control heap usage.
UnifiedMemoryManager is the default MemoryManager in Spark since 1.6 (StaticMemoryManager has been deleted in 3.0). UnifiedMemoryManager manages the executor heap in three main regions, plus a hard-reserved chunk that Spark needs for internal bookkeeping.
Let's break this down.
Reserved Memory
Before Spark gives your code anything, it quietly grabs 300MB from the executor heap just for itself — logs, metrics, internal structures, and whatever else it thinks is important.
This is hardcoded (RESERVED_SYSTEM_MEMORY_BYTES in the source) and not configurable in production. You can only tweak it in tests via spark.testing.reservedMemory, but that's irrelevant for real workloads.
Usable memory = Executor memory — 300MB
Everything else — execution, storage, user memory — comes out of this usable heap.
User Memory
This is the wild west of Spark memory. No tracking, no boundaries, no safety rails. Spark calls it, "User Memory", but it's really just a chunk of heap left over for:
- UDFs doing who-knows-what
- Python wrappers and runtime glue code
- Native ML libs like XGBoost allocating their own buffers
- Arrow buffers (which Spark ignores, but GC doesn't)
It calculated as:
User memory = Usable memory * (1 — spark.memory.fraction)
By default, spark.memory.fraction = 0.6 — so User Memory = 40%
Spark does not manage this memory. It doesn't track what you put here. If you go overboard here, you'll get GC pressure or random OOMs. Spark won't even warn you, it just dies.
Execution & Storage Memory
After Spark subtracts Reserved and User Memory, the remaining 60% of heap becomes a shared pool for:
- Execution Memory — used for shuffle, joins, aggregations, sorts.
- Storage Memory — used for caching, broadcasts, and unrolled RDDs.
They're split like this:
Execution memory =
  Usable memory
  * spark.memory.fraction
  * (1 — spark.memory.storageFraction)

Storage memory =
  Usable memory
  * spark.memory.fraction
  * spark.memory.storageFraction
By default:
spark.memory.fraction = 0.6spark.memory.storageFraction = 0.5
Which gives you:
- Execution = 30% of total heap
- Storage = 30% of total heap

Execution and Storage live in a shared memory pool. They can borrow memory from each other. This is what Spark calls -
Dynamic Occupancy Mechanism
With UnifiedMemoryManager, execution and storage don't have a hard wall between them. Their sizes are elastic, but not equal.

The creators of this mechanism decided that Execution memory always has priority over Storage memory. They had reasons to do so — the execution of the task is generally more important than the cached data, and the whole job can crash if there is an OOM in the execution.
So the rules are simple:
- If Execution needs memory, it takes it.
- If Storage is using that space (cached RDDs, broadcasts), Spark starts evicting blocks.
- If Execution is idle, Storage can grow into that space — until Execution comes back.

Internally, Spark tracks the maximum Storage usage with a threshold called onHeapStorageRegionSize. By default, it's equal to the full Storage region. The moment Execution asks for memory though, Spark shrinks that region and pushes Storage out of the way.

This leads to an important consequence. Your cache is not safe.
If you persist something with .persist(StorageLevel.MEMORY_ONLY) and later run a wide transformation — shuffle, join, aggregation — Spark may silently evict cached blocks to feed Execution memory. And yes, you'll pay the cost of recomputation later. We will talk about that in detail in the next blog post, stay tuned.
Off-heap Memory
Most Spark jobs live happily inside the JVM heap, running under the watchful eye of the GC. But Spark also has the ability to allocate memory off the heap, bypassing the JVM entirely.
Why would anyone want to do that?
Simple: GC can be the problem. Especially when you're working with:
- Giant datasets
- Millions of tiny objects
- Low-latency jobs
- Python UDFs backed by Arrow
- Or you're just tired of tuning G1GC with 18 flags
GC is expensive. When you're dealing with large datasets, the overhead of object tracking, allocation, and collection inside the JVM can kill performance. Spark's answer is to use off-heap memory to store raw data buffers and skip the JVM's babysitting.
Under the hood, Spark does this using sun.misc.Unsafe, a low-level Java API that lets you manually allocate and free memory — kind of like malloc() in C. It's fast. It's risky. It's entirely unmanaged. Which is why it's usually disabled unless you know what you're doing. (On JDK 17+ this routes through jdk.internal.misc.Unsafe, which is why some Spark builds need --add-opens flags at startup).
To enable it, you'd set:
spark.memory.offHeap.enabled=true
spark.memory.offHeap.size=1g
Now your executors will be running with two memory pools: the traditional JVM heap, and a chunk of raw memory Spark can directly write into — no GC involved. But don't get too excited: YARN (or Kubernetes) doesn't care where you allocate memory. If your total memory usage (heap + off-heap + overhead) exceeds the container limit, the executor gets killed. Period.

But! Off-heap memory isn't just some exotic optimization. It's actually core to how modern Spark works, thanks to a project you might have heard of ...
Tungsten
Tungsten is Spark's long-running effort to optimize physical execution with a heavy focus on memory. The idea is simple: Spark jobs shouldn't pay the tax of Java objects. They're heavy, they fragment the heap, and they make GC unpredictable. So Tungsten introduced:
- Custom encoders/decoders for rows (for tight binary layout)
- Explicit memory management
- CPU cache-aware execution
- Vectorized processing
- And yes — off-heap memory
Now, when you turn on off-heap memory, you're telling Tungsten to go full native. It will allocate all its memory pages directly off-heap. That gives you better GC performance and tighter control over memory — but it also means you're now responsible for not blowing up your container limits. Spark won't warn you and GC won't save you. Dramatic pause.
Furthermore, container managers like YARN or Kubernetes don't know how much off-heap memory you're using. They monitor process-level memory (RSS), not JVM heap. So if you go crazy with spark.memory.offHeap.size and forget to increase spark.executor.memoryOverhead, your job will be randomly killed with a vague container memory error.
Welcome to production.
Off-heap memory is conceptually simpler than on-heap: there's no user memory, no GC, and Spark only divides it into Execution and Storage, just like it does for the heap. In UnifiedMemoryManager, the same borrowing rules apply — Execution has priority, Storage gets evicted.

But don't let that simplicity fool you. The second you turn it on, you're on your own. No GC means no safety net. Which is great — until it's not.
Hold on, hold on… you're still here?
So you think this was good?
Thank you — genuinely.
I'm a simple man, my favorite holiday is New Year. Since we're around that time, here's a small gift:
If you like this mix of deeply technical stuff, rants, and career advice for data engineers and want the paid posts too, there's 30% off a yearly plan right now: here.
I keep some work paid so I can go deeper instead of chasing clicks. As I said before: gated knowledge is where we're heading — I'm trying to keep the gate cheap and honest.
ho-ho-ho-ho 🎄
Overhead Memory
Let's talk about the part of memory no one thinks about — until their executors start randomly dying.
When you set --executor-memory, you're only specifying the JVM heap size. But Spark executors also need memory for everything outside the heap — thread stacks, JIT buffers, metaspace, JNI, Python processes, native libs, and whatever else the JVM decides to hoard.
That's what Overhead Memory is for.
By default, Spark sets this via spark.executor.memoryOverhead. If you don't specify it, Spark will default to 10% of executor memory, or 384 MB, whichever is greater.
Since Spark 3.3, you can also use spark.executor.memoryOverheadFactor instead of an absolute size — 0.10 by default on YARN, 0.40 on Kubernetes. It scales with executor size, so set it once and forget it. The deprecated spark.yarn.executor.memoryOverhead was removed in Spark 3.0 — if you still have it lying around in old configs, delete it.
Now, you might be thinking: "Fine, that's just some buffer zone. I don't need to touch it." Not true, lemme give you an example.
Let's say you set --executor-memory=8G. Spark will default to 10% overhead, so:
spark.executor.memoryOverhead = max(0.1 * 8192MB, 384MB) = 819MB
Total memory requested from YARN or K8s:
Executor memory + Memory overhead = 8192MB + 819MB = 9011MB
Okay, not too bad.
But now, you enable off-heap memory:
spark.memory.offHeap.enabled=true
spark.memory.offHeap.size=1g
Guess what? That off-heap 1GB is not included in executor memory or overhead. So now your actual memory usage is:
8192 MB (heap)
+ 819 MB (default overhead)
+ 1024 MB (off-heap)
= 10,035 MB
But your container still only got 9011 MB, because Spark didn't include off-heap in the overhead by default. It will be killed by YARN or OOMKilled by the K8s kubelet. Not a Spark error. No nice logs. Just dead.

PySpark makes it worse
And if you're using PySpark, it's even worse.
PySpark spins up a separate Python process per task, and it uses memory outside the JVM. If you don't explicitly allocate space for it with spark.executor.pyspark.memory.
...then Spark will stuff it inside the overhead memory too. Which means now that 819MB has to cover:
- JVM internals (metaspace, thread stacks, JIT)
- Off-heap allocations
- Arrow buffers
- Python workers
That won't end well.
So here's how Spark actually calculates container memory:
val totalMemMiB =
    executorMemoryMiB
  + memoryOverheadMiB
  + memoryOffHeapMiB
  + pysparkMemToUseMiB
If you're running on YARN, that's the amount YARN allocates. If you're on Kubernetes, this becomes your pod memory limit.
TaskMemoryManager
By now, we know that Spark's MemoryManager slices executor memory into regions — execution, storage, user, and so on. But what happens when multiple tasks are running on the same executor and they all want a slice of execution memory?
They fight over it, and Spark plays referee using a component called TaskMemoryManager.
Tasks don't talk to MemoryManager directly. Instead, each task works with its own TaskMemoryManager instance, which acts as a middleman for memory allocation — both for on-heap and off-heap memory. It keeps track of how much memory each task has used, how much it's allowed to request, and whether it needs to wait or fail.

Why does this matter?
Because multiple tasks in the same executor share the execution memory pool. And there's no hard isolation between them. That means:
- Task A can show up early and grab a big chunk of memory.
- Task B shows up a few milliseconds later and finds the fridge empty.
- Task B either blocks, spills to disk, or in worst cases, just dies.
So how does Spark try to make this fair?
Spark tries to be "fair-ish" with memory by enforcing soft limits. The logic looks like this: if n tasks are running concurrently on an executor, each task is allowed to allocate between 1/2n and 1/n of the total execution memory.
That range is fuzzy by design. Spark starts by allowing each task up to 1/n of the memory. But if multiple tasks start at different times, the first one gets a little more breathing room (up to 1/2n for others). In practice, the first task often grabs more than its fair share, especially in uneven workloads or poorly partitioned data.
It's not a strict cap either — Spark doesn't stop a task immediately if it goes over. It just starts blocking other tasks, triggers spills, or (worst case) throws an OOM.
TaskMemoryManager doesn't prevent these issues — it just tries to contain the blast radius. And that's where tuning comes in:
- You can reduce
spark.task.cpusto run fewer concurrent tasks per executor. - Or allocate more
spark.executor.memoryto give the execution pool some breathing room. - Or go distributed and shrink partition sizes — fewer records per task = less memory pressure.
But if you ignore this, your "optimized" job will randomly choke on 1 out of 200 stages — and then you'll be back here, re-reading this post with tears in your eyes.
Conclusion
Today, with Spark 3.x and beyond, memory is more dynamic than ever — but that doesn't mean it's safer. Adaptive execution, columnar formats, off-heap buffers, native UDFs — all of it still shares the same physical RAM. If you don't plan for that, you will get burned.
If you're tired of manually tuning configs, tools like Spark Configuration Optimizer can give you a decent starting point. But remember: no tool will save you if you don't understand the system it's tuning.
Spark is not magic. It just looks like it — right up until the OOM.
Additional materials
- Apache Spark codebase
- Apache Spark documentation
- Spark: The Definitive Guide by Bill Chambers, Matei Zaharia
- Learning Spark by Jules S. Damji, Brooke Wenig, Tathagata Das, Denny Lee
- High Performance Spark by Holden Karau, Adi Polak, Rachel Warren
P.S. I think this also is a cool infographic to see the full picture of Spark memory management:
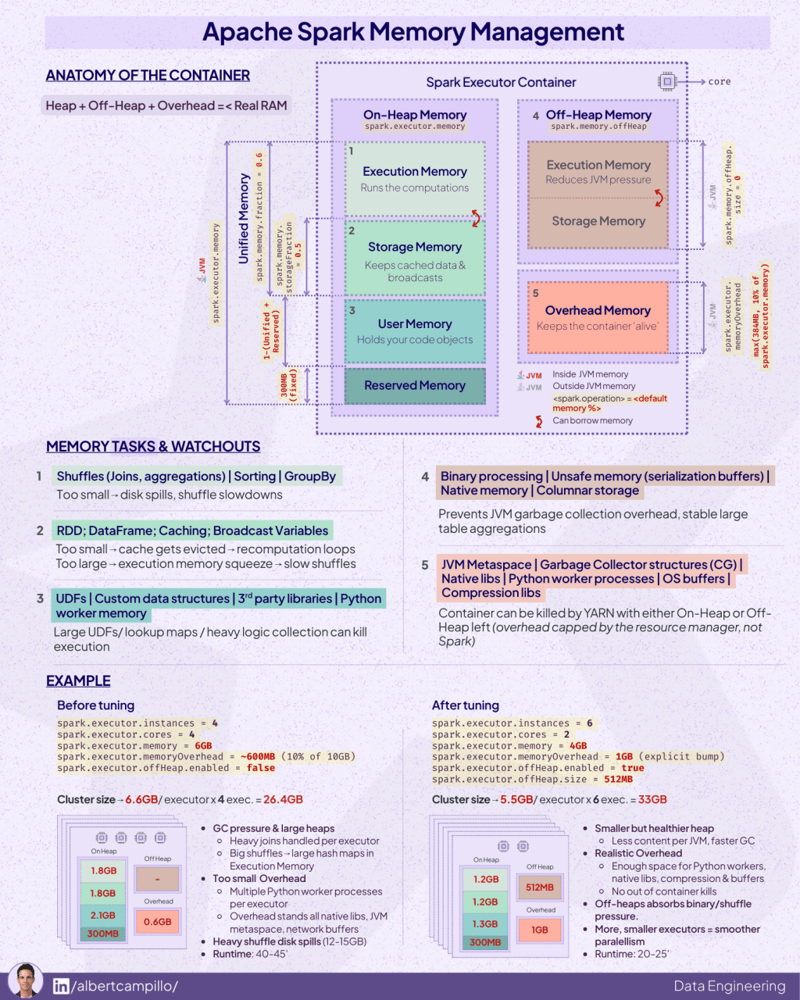
Source: By Albert Campillo