
Many engineers haven't had direct exposure to statistics or Data Science. Yet, when building data pipelines or translating Data Scientist prototypes into robust, maintainable code, engineering complexities often arise. For Data/ML engineers and new Data Scientists, I've put together this series of posts.
I'll explain core Data Science approaches in simple terms, building from basic concepts to more complex ones.
The whole series:
- Data Science. Probability
- Data Science. Bayes theorem
- Data Science. Probability distributions
- Data Science. Measures
- Data Science. Correlation
- Data Science. The Central Limit Theorem and sampling
- Demystifying hypothesis testing
- Data types in DS
- Descriptive and Inferential Statistics
- Exploratory Data Analysis
Today we will go a little further in understanding how data insides appear.
Hypothesis testing
It starts with a hypothesis.
So what's a hypothesis?
It is an educated guess about something. For a guess to become a hypothesis, it has to be testable — that's the main condition. For example, you can test if the conversion level will increase by 20% when the headline changes. But you cannot consider as a hypothesis the question "Will name change lead to an increase in several conversions?".
Therefore, the process of checking Hypotheses consists of forming questions about data based on collected information and testing them by statistical methods.
Example: Testing the hypothesis that women spend more time on the phone than men. Suppose that 62 men and 53 women participated in the study. The average talk time was 37 minutes per day for men and 41 minutes for women. At first glance, the differences are obvious and the results support the hypothesis. However, such a result can be obtained by chance, even if there are no differences in the population. Therefore, the question arises — is it enough to say that in general, women on average talk longer on the phone than men? What is the probability that this is the case? Is the difference statistically significant?
Null hypothesis and the alternative hypothesis

The null hypothesis is a statement about a population that is usually defined as no difference between the two groups, no impact of a factor, no effect, and so on. For our example, it would be an assumption that women and men spend the same amount of time talking on the phone.
Another hypothesis to be tested (not always the strict opposite of the first one) is called the alternative hypothesis. For the example above, it would be that women spend more time talking on the phone than men.
When I first started to understand this topic, I couldn't understand why the null hypothesis is a tested assumption, it seemed to me that the null hypothesis should be our guess about the population (H0 changed to H1). Over time, I realized that the null hypothesis is essentially a null state — we assume that we know nothing about the population. An alternative hypothesis is the tested assumptions about the population, the next state, and the next level of knowledge. It sounds logical, doesn't it?
Significance Levels
When testing statistical hypotheses, one can make a mistake by accepting or rejecting the correct hypothesis. Essentially, the error is the probability of a random occurrence of the detected difference in data that falls under our hypothesis. We want to somehow control the level of that error that a researcher admits in a statistical test, for this purpose, we introduce the notion of significance levels.
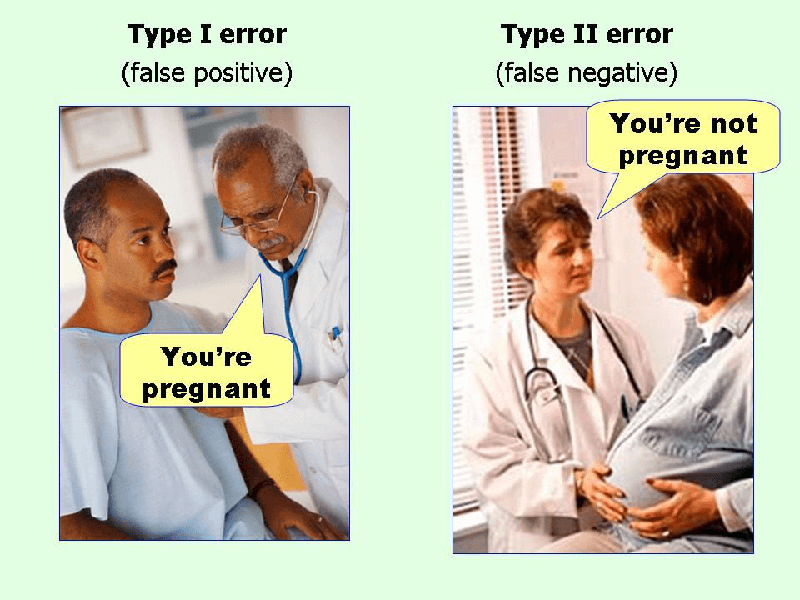
The level of significance is a threshold probability of error for rejecting the null hypothesis when it is correct, so-called Type I error. In other words, it is acceptable (from the researcher's point of view) to make a statistical error when differences are considered significant, but they are random. This probability is otherwise called p-value.
Right away, I will tell you about the error Type II — rejection of the null hypothesis with the conclusion that there is no effect when it really exists.
 .
.
Significance levels 0.05, 0.01, and 0.001 are usually used because the lower the significance level is, the lower the probability of type I error.
Example, significance level 0.05 means that the error probability is not more than 5%.
Consequently, the null hypothesis can be rejected in favor of the alternative hypothesis if according to the results of the statistical test the probability of error, i.e. the probability of an accidental occurrence of the detected difference, does not exceed 5 out of 100, i.e. there are only 5 chances out of 100 for an error. If this level of significance is not achieved (the probability of error is more than 5%), suppose that the difference can be random and therefore the null hypothesis cannot be rejected.
 .
.
Cool video for fixing who did not understand anything at all
Choosing statistical criteria
The general idea of hypothesis testing includes:
- To make two hypotheses so that only one can be correct.
- Collecting evidence (data).
- Formulating an analysis plan, and setting criteria for decision-making.
- Physically analyze data samples. Calculate the test statistics.
- Based on the available evidence (data), either accept or reject the null hypothesis.
The first two steps are clear — we make an assumption and collect all necessary data. The rest of the steps may vary based on statistical criteria.
In order to decide which hypothesis (zero or alternative) should be accepted, statistical criteria are used, which include methods for calculating a certain indicator on the basis of which the decision to reject or accept a hypothesis is made, as well as the conditions for making that decision.
For data obtained in metric scales (interval or relative) for distributions close to normal, parametric methods are used, based on indicators such as the mean and standard deviation. This is used, for example, to determine if samples come from the same population. In particular, Student's t-test is used to determine the reliability of the difference in means for two samples. Also, F-test or analysis of variance (ANOVA) is used to understand differences between three or more samples. In addition, the ANOVA test is often used to determine the effect of independent variables on a dependent variable in a regression study.
If the researcher is dealing with non-metric (nominal or ordinal) scale data, or samples are too small to be sure that the populations from which they are taken based on a normal distribution, use non-parametric methods — Chi-square test, Mann-Whitney U test, Wilcoxon signed-rank test. These methods are very simple both in terms of computation and usage.
The choice of statistical criteria also depends on whether the samples are independent (i.e., taken from two different groups) or dependent (i.e., reflecting the results of the same group of subjects before and after exposure or after different effects).
Conclusion
Hypothesis testing is most often used in A/B testing, or simply to gain new knowledge about the data.
Hypothesis testing is an essential procedure in statistics. It evaluates the statements about a population to determine which statement is best supported by the data sample.
There are certain steps in the hypothesis testing algorithm. But there is one that can be different — the choice of statistical criteria. It is not trivial and requires some knowledge of the analyzed data as well as the conditions in which the criteria can be used.
Do not believe anybody except the data and test even the most obvious hypotheses.