
Many engineers haven't had direct exposure to statistics or Data Science. Yet, when building data pipelines or translating Data Scientist prototypes into robust, maintainable code, engineering complexities often arise. For Data/ML engineers and new Data Scientists, I've put together this series of posts.
I'll explain core Data Science approaches in simple terms, building from basic concepts to more complex ones.
The whole series:
- Data Science. Probability
- Data Science. Bayes theorem
- Data Science. Probability Distributions
- Data Science. Measures
- Data Science. Correlation
- Data Science. The Central Limit Theorem and Sampling
- Data Science. Demystifying Hypothesis Testing
- Data Science. Data types
- Data Science. Descriptive and Inferential Statistics
- Data Science. Exploratory Data Analysis
True logic of this world lies in the calculus of probabilities
— James Clerk Maxwell
Data science heavily relies on statistical inference to extract insights or make predictions, while inference itself depends on probability and its properties. So, understanding probability and its applications is essential for tackling data science problems effectively.
The probability explanations below follow the Frequentist perspective, which is often more intuitive for beginners.
Events and Event Probabilities
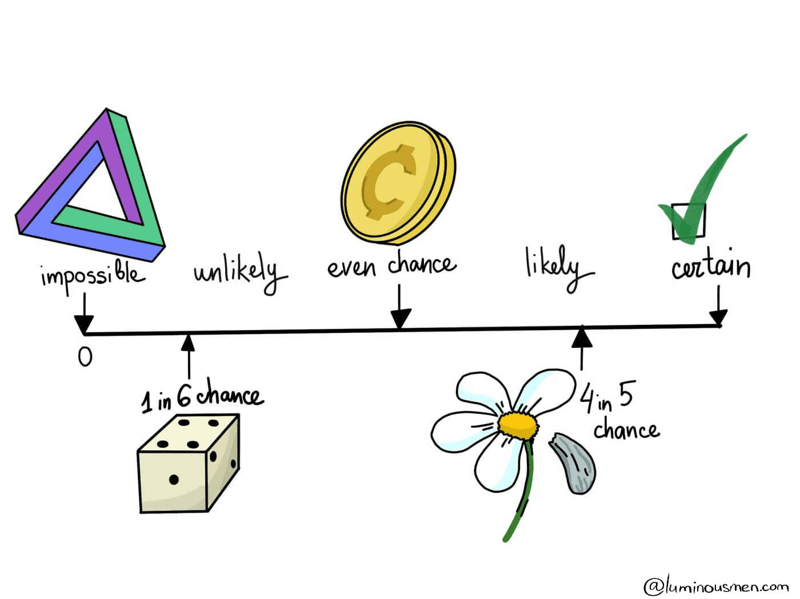
One of the basic concepts in statistics is an event. In statistics, an event is simply the result of an experiment and can be classified as certain, impossible, or random:
Certain event is an event that as a result of an experiment (the execution of certain actions with a certain set of conditions) will occur in 100% cases. For example, a tossed coin will certainly fall (on the Earth conditions).
Impossible event is an event, as the name implies, that will not occur as a result of the experiment. For example, a tossed coin will fly in the sky — this is an "impossible" event.
And finally, an event is called a random event if the event may or may not occur as a result of the experiment. There should be present fundamental criteria of randomness in such an experiment. A random event is a consequence of random factors which influence cannot be predicted or such predictions can be extremely difficult. For the coin toss example, random factors are the shape and physical characteristics of the coin, the strength/direction of the throw, air resistance, etc. These are factors that are extremely hard to predict.
Let's examine a coin toss more closely (meaning a fair coin — a coin in which both results ("heads and tails") are equally likely). There are 2 mutually exclusive outcomes — heads or tails. The outcome of the flip is random since the observer cannot analyze and take into account all the factors that influence the result. What is the probability of heads? Most answer ½, but why?
Let's name A the event that came up as tails. Let the coin be thrown n times. Then the probability of event A can be defined as:
\text{The probability of an event happening} = \frac{\text{Number of ways it can happen}}{\text{Total number of outcomes}}
This formula represents the frequency of event A in a long series of tests.
Example:
There are 4 Kings in a deck of 52 cards. What is the probability of picking a King?
- Number of ways it can happen: 4 (there are 4 Kings)
- Total number of outcomes: 52 (total cards in the deck)
So the probability = 4/52 = 1/13
It turns out that in various test series the corresponding frequency for large n is fluctuating around a constant value P(A). This value is called the probability of event A and is denoted by the letter P — an abbreviation for Probability.
The probability lies in the range [0, 1], where, in general, 0 indicates the impossibility of the event, and 1 indicates certainty. The higher the probability of an event, the greater the likelihood that an event will occur.
Example:
What is the probability of drawing a Jack or a Queen from a well-shuffled deck of 52 cards?
- Possible ways: 4 (for Jacks) + 4 (for Queens) = 8
- Total outcomes: 52 cards
P(\text{Jack or Queen}) = \frac{8}{52} = \frac{2}{13}
Event types
Independent and Dependent Events
Two random events A and B are called independent if the occurrence of one of them does not change the probability of the occurrence of the other. Otherwise, events A and B are called dependent events.
Counterintuitively, knowing that the coin landed on the head on the first toss, does not provide any useful information for determining what the coin will land on the next toss. The probability of a head or a tail on the next toss is still 1/2, regardless of the outcome of the first toss.
Probabilities of independent events should be multiplied to get the total probability of the occurrence of all of them.
Example:
What are the chances of getting heads 3 times in a row?
Let's define possible outcomes of 3 coin tosses(H - heads, T - tails): HHH, HHT, HTH, THH, TTH, THT, HTT, TTT
- Number of ways it can happen: 1
- Total number of outcomes: 8
So, the answer is 1/8. However, we know that the results of a coin toss are independent and we can multiply them to get the total probability:
P(\text{3x heads}) = P(heads)P(heads)P(heads) = \frac{1}{2}\frac{1}{2}\frac{1}{2} = \frac{1}{8}
On the other hand, knowing that the first card drawn from a deck is an ace does provide useful information for calculating the probabilities of consecutive draws. So, the probability of drawing yet another ace is going to be 3 over 51, instead of 4 over 52 because we know that we already remove one of the aces from the deck. You can think about that in your next poker game.
Disjoint and Overlapping Events
Disjoint events cannot happen simultaneously, like getting both heads and tails on a single coin toss. A synonym for this term is "mutually exclusive".
Overlapping events can happen at the same time. Therefore they can overlap, and the probability of overlapping should be excluded from total probability to avoid double counting.
Example:
What is the probability of drawing a Jack or a Red card from a well-shuffled deck of 52 cards?
Several ways it can happen: 4 (there are 4 Jacks) and 26 (there are 26 Red cards). But there are 2 Red cards overlap between them. Two red jacks that fit both criteria.
Total number of outcomes: 52 (there are 52 cards in total)
P(\text{Jack or Red}) = P(Jack) + P(Red) - P(\text{Jack & Red}) = \frac{4}{52} + \frac{26}{52} - \frac{2}{52} = \frac{7}{13}
Types of Probabilities
Joint Probability
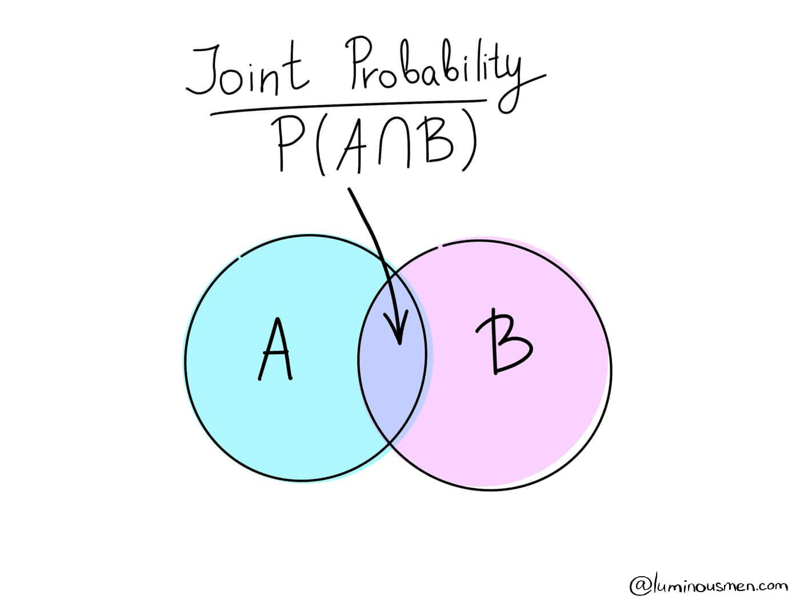
Joint probability is a type of probability where more than one event can occur simultaneously. The joint probability is the probability that event A will occur at the same time as event B.
For example, from a deck of 52 cards, the total probability of receiving a red 6 card is P(6 ∩ red) = 2/52 = 1/26, since there are two red sixes in the deck of cards — ♦6 and ♥6. You can also use the formula to calculate the total probability:
P(6 \cap \text{red}) = \frac{2}{52} = \frac{1}{26}
The symbol "∩" in joint probability is an intersection. The probability of occurrence of an event A and an event B is the same as the intersection of A and B sets. Venn Diagram is perhaps the best visual explanation for that.
Marginal probability
Marginal probability — a probability of any single event occurring unconditioned on any other events.
Whenever someone asks you whether the weather is going to be rainy or sunny today(without any conditional or prior information), you are computing a marginal probability.
Conditional probability
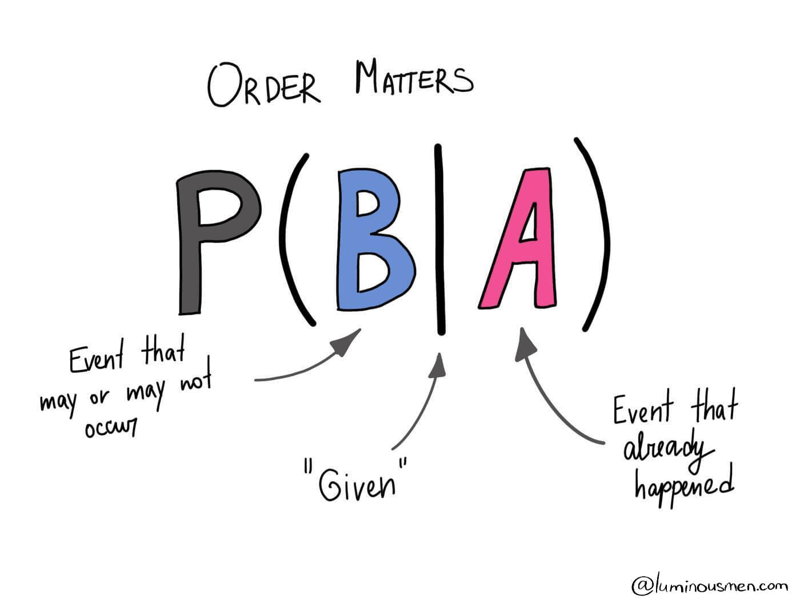
Conditional probability — is a probability of an event given that (by assumption, presumption, assertion, or evidence) another event has occurred.
When I ask you what is the probability that today will be rainy or sunny given that I noticed the temperature is going to be above 80℉, you are computing a conditional probability. There is a specific notation for conditional probability shown in the image above.
So, we want to understand the probability of event B given A. It is defined as the probability of the joint of events A and B divided by the probability of B. Thus,
P(B|A) = \frac{P(A \cap B)}{P(B)}
Example:
In a math class, 25% passed both tests, and 42% passed the first test. What is the probability that those who passed the first test also passed the second?
P(Second|First) = \frac{P(First ∩ Second)}{P(First)} = \frac{0.25}{0.42} = 0.6 = 60%
Conclusion
In this post, we explored fundamental probability concepts and probability algebra. In the next post, we will talk about the Bayes theorem and look at the world through the eyes of Bayes.