
Mastering Theta Sketches for Cardinality Estimation
In the last post, we covered the landscape of data sketches and why they matter. Now, let's get into the one I reach for the most, and the one that's saved me more times than I can count.
This is everything I wish someone had told me when I started with Theta Sketches — the inner machinery, the tuning decisions, and the patterns that blow up in production.
What Makes Theta Special
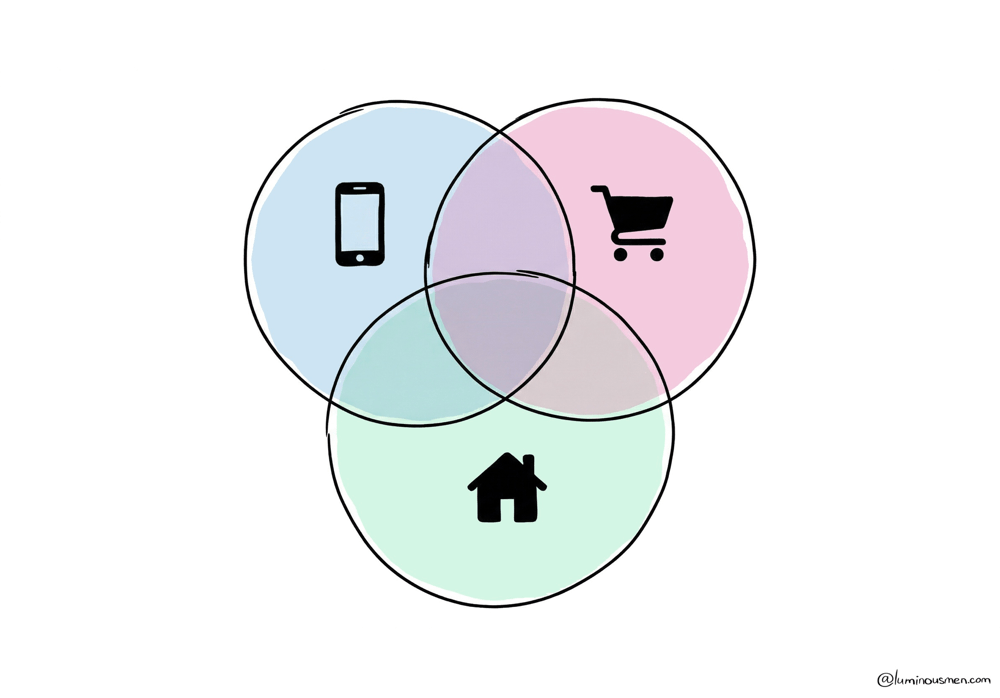
Real analytics questions are never "count this one thing". They're "How many users visited the homepage AND made a purchase?" or "How many came from mobile but NOT desktop?" — set operations on unique counts. Despite their commonality in the real world, these are the questions where most queries and data pipelines fall apart.
There are simpler cardinality sketches out there. HyperLogLog is smaller. CPC is even more space-efficient. But intersection? Good luck.
Only Theta gives you the full set algebra toolkit with well-characterized error bounds (it is still a probabilistic data structure — do not forget that!). With exact methods, those queries are nightmares at scale but with Theta Sketches, they're almost boring.
The Core Idea
Before we get into the mechanics, let me give you the basic intuition.
Imagine you're trying to estimate how many unique people visited a beach today. You can't count everyone precisely — there are millions of visitors and no time — but you can be clever about it.
You sit at the entrance with a coin and a notebook. For each person that walks in, you flip the coin. Heads? Write down their name. Tails? Ignore them. At the end of the day, you have 50 unique names. Since you only kept the heads (50% chance), you estimate the total: roughly 100 unique visitors.
Simple enough. But Theta Sketches are smarter than a coin flip — they adjust the "acceptance rate" on the fly based on how full your notebook is.
Say you only have room for 100 names. You start by accepting everyone. Once you go over 100, you don't just keep adding — you raise the bar and throw some away.
Concretely: you score everyone you've kept, sort them, and keep only the top 100. Everyone else gets dropped.
That cutoff becomes your new acceptance threshold. Next time someone walks in, you only keep them if they beat that threshold. The sketch constantly "tightens" the sample to stay within a fixed size while remaining statistically valid.
At the end, you count your names and check the final acceptance rate. If it's 1%, you estimate 100 / 0.01 = 10,000 unique visitors. Neat.
Fixed memory. Predictable error. Full set algebra on unique counts. Now let's see how it actually works.
This is a premium deep-dive
You just read the free excerpt. The full analysis continues on Substack.
Read full article → Or subscribe to get all premium posts